Gradient Dissents
I created something new. Actually, I am creating something new and I am proud to say that I finally got to name something after my favorite cephalopod, the humble cuttlefish. Don’t know what a cuttlefish is?
here’s one
…and here’s another
They’re basically chameleon squids but more chameleon than a chameleon and more squid than a squid and they obviously can do things with color that hummingbirds do with flight.
cuttlefish (you can find the repo here) is a package in which you can take your favorite images and extract the colors from them to form a color palette. Right now there is one main function that you would use to do this with two different methods of color extraction, which is what the remainder of this post is about. I know, you were hoping for more animal gifs.
Imagine we have the following image.
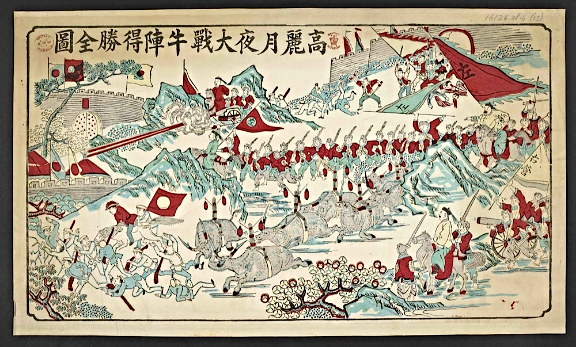
The print is Chinese and the artist is unknown. You can read up more about the piece here. The colors are simply perfect for demonstrations purposes.
We start this out like we start out most…install the package.
devtools::install_github("jcbain/cuttlefish")Next, we load it up.
library(cuttlefish)Then you simply call the create_palette() function with a path to the image and the number of colors you want to extract.
cols <- create_palette("chinese_latterns.png", n=5)

# scales to display the palette
scales::show_col(cols)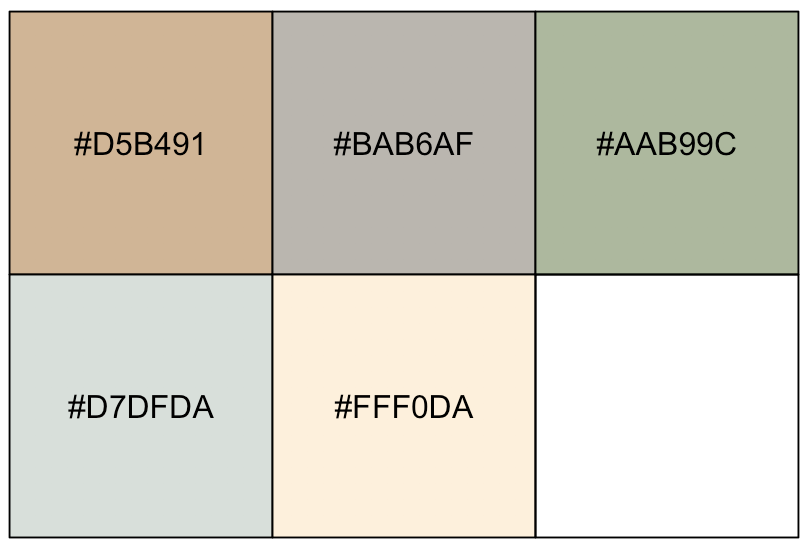
Note, if you are following along, you might realize that the color palette you were given is different than the color palette that I’m displaying here. That is because cuttlefish’s find_segments function randomly picks a color from all of the unique colors in the image as a starting point. These colors are represented in the HSV (hue saturation value) color space because the color hues are projected onto an angular dimension from 0˚ to 360˚. This is important because I wanted to maximize the distance between segments to avoid overlap in colors when segmenting the color palette. In other words, I wanted colors to be 360˚/n away from one another. Now, you may be asking, “What if there isn’t a color that is 360˚/n away from color i?” Well, I simply take the closest color to that distance away from color i. Now you could be thinking, “What if multiple colors are equidistant?” Simple, since all colors are unique from the possible selection, you can either take the farthest in terms of saturation and value of the subset of close colors or the closest by specifying max.distance parameter. TRUE will return the most distant by saturation and value and FALSE will return the nearest. This was a design decision and some might want colors of a more similar saturation. For example, you could do
cols <- create_palette("chinese_latterns.png", 5, max.distance = FALSE)Now, occasionally images won’t contain a distribution of a lot of colors (although the image probably has a bunch of unique colors). This is often the case with logos. For this, using the default segmentation above might not provide what is wanted. Instead, I’ve built an option to find the most prominent colors in the image by simply specifying prominent.ord=TRUE in the create_palette function. Take the NPR logo for instance.
![]()
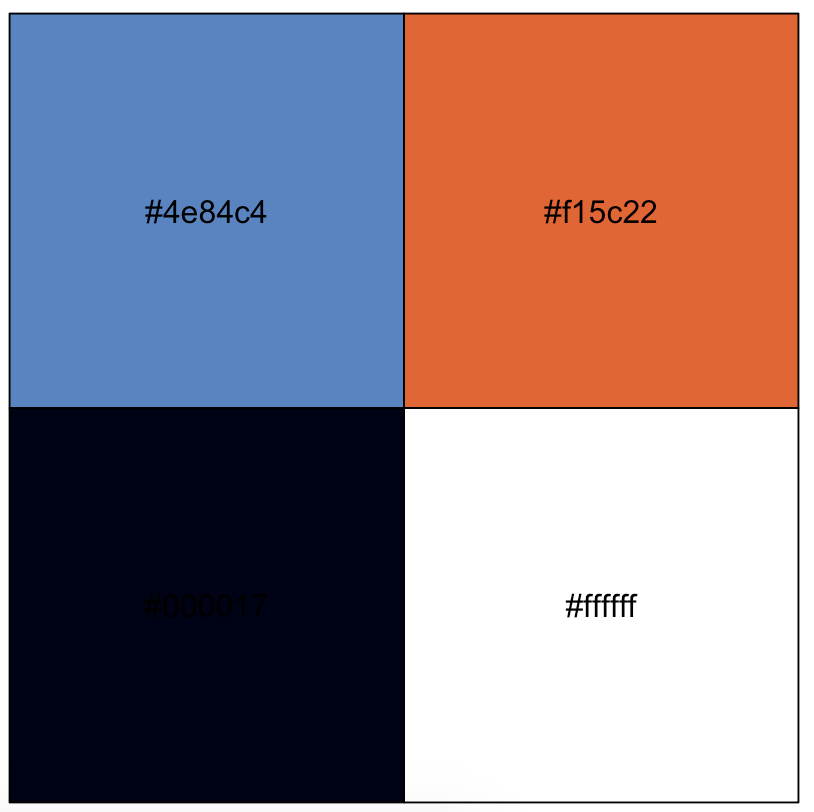
cols <- create_palette("npr_logo.png", n = 4, prominent.ord = TRUE)

scales::show_col(cols)
Would provide…
I know that there isn’t a whole lot of functionality quite yet but I will be building it up over the months to come. There is one final bit though before closing up this post. Like any respectable and non-respectable R package, cuttlefish needed a hex sticker so a hex sticker I created…